
Day trading is a fast-paced way to play the stock market. It involves buying and selling stocks on the same day. The right tools can make all the difference, and that’s where indicators come in.
Indicators are like secret codes that help traders make smart moves. They use math to look at things like how much prices change and when the best time is to buy or sell.
Forex traders find these tools super handy because they deal with different money from around the world. Since forex markets are open almost all the time, having good indicators can really help spot chances to make money.
Some of the best day trading indicators include the moving average and the exponential moving average (EMA). These show trends over time. There’s also MACD, which helps spot changes in trends early on; Stochastic Oscillator for figuring out if it’s too late or too soon for a trade, RSI, which tells you if something is bought too much or not enough; Bollinger Bands for tracking price range and volatility, Fibonacci Retracement for identifying support or resistance levels, Standard Deviation, which measures how spread out prices are from an average price indicative of their volatility; Ichimoku Cloud, revealing multiple pieces of information about future price action at once, such as momentum as well as dynamic support and resistance levels before they happen, allowing ample time for reaction; and Client Sentiment, giving insight into what other traders feel about current market conditions based on real trades being placed rather than just speculation alone.
Smart traders use more than one indicator, along with looking at big news items and studying price charts closely, to get a full picture before deciding on a trade. IG US LLC gives people awesome platforms where they can learn forex trading using these indicators by starting an account easily—it’s perfect practice!
Even though this guide doesn’t tell you everything there is to know about advanced stuff like on-balance volume or the arc indicator right away—those details come later—it does give excellent first steps towards making better trades with less guesswork involved.
Remember, if you only risk money, you’re okay with losing because all investments come with risks!
Get ready to discover how these powerful tools can lead your path towards successful day trading! Keep reading; there’s plenty more ahead!
Understanding Chart Indicators
Chart indicators are like a trader’s tools. They help make sense of market trends and price movements. These powerful calculations allow traders to identify potential buy or sell signals.
Technical analysis relies heavily on these indicators.
Traders often combine different types of chart indicators for better results. For example, moving averages show the average price over time, hinting at the trend direction. Meanwhile, the relative strength index (RSI) can signal if a stock is overbought or oversold.
Using these together helps traders make more informed decisions.
In day trading, understanding chart indicators is key to success. Each indicator serves a unique purpose in reading the market’s story as it unfolds in real-time. A moving average might point out a trend’s direction, while Bollinger bands can provide insight into market volatility.
Successful traders don’t just use one indicator; they blend several to check their accuracy against each other—a practice known as “confirmation.” This layered approach adds depth to technical analysis and aids in risk management by offering multiple perspectives on where the markets might be heading next. Additionally, you can also read about- Top 3 E-Commerce Stocks.
Importance of Trading Indicators in Forex
Trading indicators guide Forex traders through a sea of market movements with signals for entry and exit points. They capture the pulse of currency pairs, showing when to jump in or step out.
In a 24-hour trading cycle, these tools become vital for making informed decisions without having to watch the markets every minute.
Forex indicators also highlight trends and potential reversals. This insight is crucial since currencies often move in waves due to economic announcements or shifts in global financial flows.
Day traders use these signs to time their trades better, increasing their chances of success in an arena where speed and precision are key.
Best Day Trading Indicators
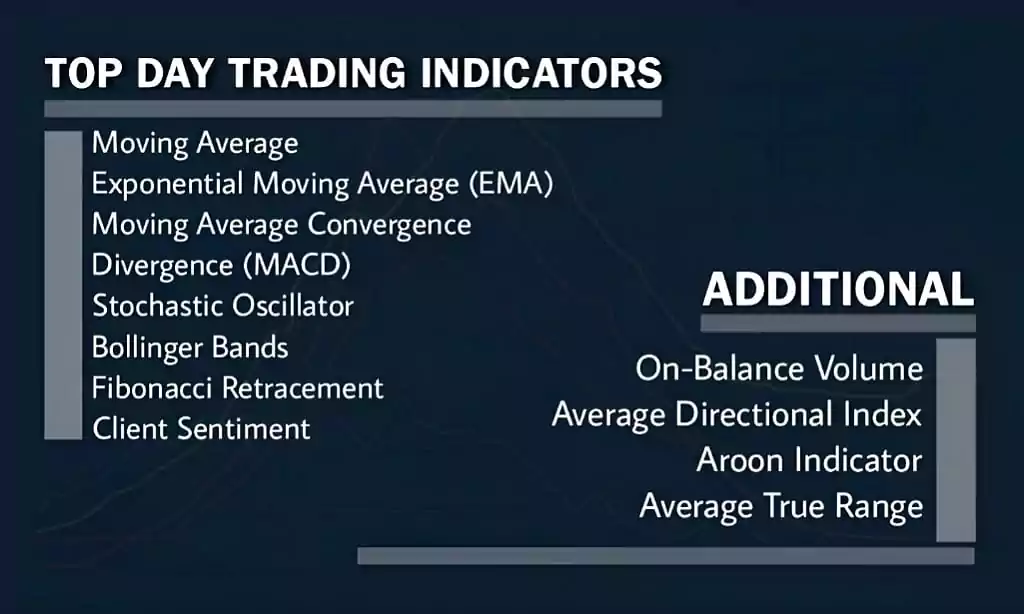
Exploring top-day trading indicators is fundamental for traders looking to sharpen their market edge; these tools serve as navigational beacons in the tumultuous seas of the stock market, illuminating trends and patterns critical to making informed decisions. Continue reading to master their application.
Moving Average
The moving average simplifies price data by smoothing it out and making trends easier to spot. It’s a must-have on any day trader’s chart. You can use this tool to identify support and resistance levels as markets fluctuate over time.
With the Simple Moving Average, you get an average price over a specific number of periods. This helps smooth out short-term fluctuations and highlights longer-term trends or cycles.
Day traders trust the moving average because it’s versatile and simple. They watch for trend reversals when prices cross over their moving averages. Often, they’ll combine multiple moving averages—one slow, one fast—to pick up buy signals during upward trends or sell signals during downward ones.
The moving average is not just popular; it’s pivotal for strategy building in day trading scenarios where success hinges on timing market movements correctly.
Exponential Moving Average (EMA)
Exponential Moving Average, or EMA, stands out as a top choice for day traders seeking to track market trends. It reacts quicker to price changes than a simple moving average because it puts more emphasis on recent data.
This quality makes the EMA an essential tool in fast-moving markets like forex, where catching up with sudden swings is crucial.
Traders use EMAs to pinpoint both the direction of a trend and spots for getting in or out of trades. They often pair EMAs with other technical indicators to validate their moves and build robust trading strategies.
An example is monitoring EMA crossovers, which can signal potential reversals in the market’s direction. Such techniques are vital for professionals aiming for success in dynamic financial environments.
Moving Average Convergence Divergence (MACD)
The Moving Average Convergence Divergence, or MACD, is a powerhouse for day traders. It uses two moving averages to show momentum in the market. One line represents the difference between two exponential moving averages (EMAs), and another shows a signal line.
Traders watch these lines closely.
A crossover of these lines can hint at a trend change. When the MACD crosses above its signal line, that’s bullish—time to think about buying. If it dives below, bearish times may be ahead, pushing traders to sell or go short.
But there’s more than just crossovers; convergence and divergence give extra clues on strength and potential shifts in direction. By spotting these signs early, savvy traders jump on opportunities quickly.
Stochastic Oscillator
The stochastic oscillator shines as a momentum indicator. It captures the speed of price movements by comparing a particular closing price to its range over a certain period. This tool helps traders spot strong buy and sell signals, especially in volatile markets like forex trading and equities.
Values above 80 signal that an asset might be overbought, while readings below 20 indicate it could be oversold.
This indicator uses two lines—K and D—to forecast potential price changes. When these lines cross each other, it’s often a sign that the current trend is weakening. Traders watch these crossovers closely for hints on when to enter or exit trades.
Mastering the stochastic oscillator along with other key indicators can significantly improve decision-making in short-term trading strategies.
Bollinger Bands
John Bollinger created Bollinger Bands to identify market momentum and potential price trends. They act like elastic bands around the price chart, expanding and contracting as volatility changes.
As prices move closer to the upper band, the market may be considered overbought; when they reach the lower band, it could indicate an oversold condition.
Traders rely on these bands for clues about trend strength and direction shifts. If a stock consistently hits the upper boundary of its Bollinger Bands, it shows a powerful uptrend.
Conversely, tapping repeatedly on the lower band suggests downward pressure. Adjusting settings allows traders to tailor their approach: wider bands mean more tolerance for risk, while tighter ones signal caution during periods of low volatility.
With customization at heart, Bollinger Bands provide unique insights across forex markets, stocks, or futures—essential tools for managing risks smartly while striving for trading victory.
Relative Strength Index (RSI)
The Relative Strength Index, or RSI, is a powerful tool for day traders. It helps spot overbought and oversold securities. Overbought means prices may fall soon; oversold suggests they might rise.
The RSI measures price movement speed and change, giving insights into market momentum.
Traders trust the RSI to make quick buy-or-sell decisions during trading sessions. This indicator shows trend strength and direction with numerical values between 0 and 100—values above 70 signal overbought conditions; values below 30 indicate oversold markets.
Successful traders use the RSI with other indicators for informed strategies in fast-paced financial markets like Forex.
Fibonacci Retracement
Fibonacci Retracement uses horizontal lines to indicate where possible support and resistance levels might be. It’s based on the idea that markets will retrace a predictable portion of a move before continuing in the original direction.
Traders pick major high and low points on a chart, and the indicator plots percentage retracement levels between these two points.
These levels are grounded in Fibonacci numbers, which occur naturally all around us—like in seashells or galaxies. In trading charts, they act as markers where price action could experience stalls or reversals.
Many forex traders find this tool especially valuable since currency pairs often fluctuate within certain boundaries before breaking out. It gives them clear areas to watch for potential turns in market sentiment or price trends.
You May Find Interest: How to Trade SPY.
Standard Deviation
Standard deviation matters a lot in day trading. It tells you how much the prices are moving around. Think of it like a ruler for risk and volatility. Prices that jump up and down a lot have a high standard deviation, while stable prices show a low standard deviation.
Smart traders watch the standard deviation to decide when to buy or sell. It helps them spot trends or times when the market might turn around. They pair it with other tools to make even better trades.
This way, they manage risks well and make smarter choices on when to get into or out of trades.
Ichimoku Cloud
The Ichimoku Cloud stands out as a dynamic indicator, essential for gauging market momentum and trends. It leverages historical data to offer traders a complete picture of potential support and resistance levels.
This tool combines multiple averages to create a “cloud” that helps predict where prices may find support or resistance in the future.
Traders rely on the Ichimoku Cloud for clear trading signals about when to enter or exit trades. Its middle line is tied to a 20-day simple moving average (SMA), while its bands adjust based on volatility, an invaluable feature for day traders seeking swift decisions without sifting through extensive market data.
With this indicator, you can quickly spot shifts in price momentum and adjust your strategies accordingly.
Client Sentiment
Client sentiment is a powerful tool for day traders. It measures the overall attitude of investors toward a particular financial market or instrument. You can see what other traders are doing, whether buying or selling, and in what volume.
This information helps you understand market trends and make better trading decisions.
Using client sentiment alongside other indicators gives you an edge. Think of it as getting insider knowledge about where the market could move next. Be cautious, though; don’t rely solely on one indicator.
Mix client sentiment with technical analysis to confirm your strategies before taking action on leveraged products or foreign exchange markets. Always stay updated with economic calendars and news feeds to keep your finger on the market pulse while using liquidity data from Client Sentiment for informed trade positions on platforms like Meta Trader or City Index.
Incorporating Indicators into Trading Strategy
Choose your indicators wisely to shape a robust trading strategy. Make sure they align with your goals and style of trading. Remember, no single indicator is perfect; each one may signal different things about the market.
Use a mix of leading indicators, like the stochastic oscillator, to predict future price movements and lagging indicators, such as moving averages, to confirm trends that have already begun.
Test these tools on past market data first. See how they would have performed before applying them in live trades. Keep an eye on key events that can affect your indicators’ performance, like changes in interest rates or updates from the S&P 500.
Your strategy should be flexible enough to adapt when these scenarios occur while still providing consistent results across different asset classes and conditions in equity markets.
Taking Long and Short Positions Using Indicators
Traders use indicators to decide when to buy or sell. These tools help predict price moves and market trends.
- Look for a Moving Average crossover. A short position might be good when the short-term average crosses below the long-term average.
- Watch the RSI. Values over 70 suggest a market is overbought, while under 30 may mean it’s oversold.
- Use Bollinger Bands for volatility clues. Sell if prices hit the upper band and look oversold; buy at the lower band if they seem overbought.
- Check out MACD histograms. Falling histograms suggest a bearish trend; rising ones indicate bullish momentum.
- Observe the Stochastic Oscillator. It compares current price to price range over time—selling at high Stochastic levels can be smart.
- Apply Fibonacci Retracement for support and resistance levels. These can hint at where prices might turn around, showing potential entry or exit points.
- Monitor Standard Deviation to gauge market volatility. High values mean big price fluctuations—traders often go short in volatile markets.
- Analyze Ichimoku Clouds for more insight. If the price is below the cloud, consider a short position; above it could signal a long position.
- Pay attention to Client Sentiment reports. They show what other traders do—going against the crowd can sometimes pay off.
- Use On – Balance Volume (OBV) to confirm trends. If OBV rises with prices, it supports a long trade; falling OBV may back a short trade decision.
- Examine Average Directional Index (ADX) strength before trading on margin. Strong trends (ADX above 25) can lead to profitable long or short positions depending on trend direction.
Additional Advanced Indicators

While the core indicators offer a solid foundation for day trading strategies, those looking to elevate their market analysis can explore additional advanced indicators. These sophisticated tools delve deeper into volume trends, directional momentum, and volatility levels—key aspects that sharpen decision-making for seasoned traders seeking an edge in fast-moving markets.
On-Balance Volume
On-Balance Volume (OBV) is a powerful tool in the hands of traders. It uses volume flow to predict changes in stock price. Traders look at OBV for a simple reason: it combines price and volume to show how money may be flowing into or out of a stock.
If OBV is rising, buyers are willing to step in and push the price higher. When OBV starts to drop, it can signal that sellers are taking control.
Smart investors watch OBV along with other indicators. They use it to confirm an asset’s trend or spot possible reversals before they happen. For example, if a stock is going up but its OBV is going down, trouble could be coming.
This mismatch tells you that despite rising prices, there may not be enough buying power to keep the uptrend alive. On flip side, if a stock’s price falls but its OBV holds steady or rises, the sell-off might soon end as buying pressure builds up.
Average Directional Index
The Average Directional Index, or ADX, tracks the strength of a trend. It’s a valuable tool for day traders who want to grasp the force behind price movements. You’ll find it as a line on your chart that can rise and fall between values of 0 to 100.
A high ADX value often points to a strong trend, while a low ADX suggests a weaker one.
Use the ADX indicator wisely by combining it with other tools like moving averages or MACD. This approach enriches your analysis and helps confirm if you’re making solid trading decisions based on robust trends.
It’s crucial in markets where catching strong trends early could mean significant profits. Remember, integrating multiple indicators offers reassurance beyond relying solely on one metric for decision-making.
Aroon Indicator
Day traders look for trends, and the Aroon Indicator is a key tool to spot them. It measures if an asset is trending and how strong that trend is. You can find short-term patterns with this indicator, making it valuable for quick decisions.
Understanding the arc indicator sets you apart in day trading. It uses two lines: Aroon Up and Aroon Down. When these lines cross, they signal potential changes in price direction.
Smart traders use this information to make moves before others catch on. Use the Aroon indicator to stay ahead in the game of fast-moving markets! If you want you can also read- Discover If Meta Transforms Into a Value Stock.
Average True Range
The average true range (ATR) is a powerful tool for measuring market volatility. It looks at the range of trading prices to gauge how much an asset could move in the future. Traders use ATR to set better stop-loss orders and safeguard their investments from sudden price swings.
This indicator helps you spot calm and stormy periods in the market, so you know when to trade big or play it safe.
Incorporating ATR into your analysis sharpens your strategy, especially on platforms like ThinkorSwim that support advanced charting and indicators. Combine ATR with others like MACD or RSI for a clearer picture of where prices might head next.
Use this insight to manage risks and refine your approach, staying ahead in the fast-paced day trading arena.
Conclusion
Mastering day trading indicators can set you on the path to success. Have you thought about how using these tools will change your trades? Picture making informed, swift decisions with confidence.
Don’t just read about these best day trading indicators; try them out and see the difference they make. Remember, every successful trader started somewhere—why not start by mastering these powerful indicators? Let today be the day you take that first step towards your trading triumphs!